Skip Nav Destination
Close Modal
Update search
Filter
- All
- Title
- Author
- Author Affiliations
- Full Text
- Abstract
- Keyword
- DOI
- ISBN
- EISBN
- ISSN
- EISSN
- Issue
- Volume
- References
Filter
- All
- Title
- Author
- Author Affiliations
- Full Text
- Abstract
- Keyword
- DOI
- ISBN
- EISBN
- ISSN
- EISSN
- Issue
- Volume
- References
Filter
- All
- Title
- Author
- Author Affiliations
- Full Text
- Abstract
- Keyword
- DOI
- ISBN
- EISBN
- ISSN
- EISSN
- Issue
- Volume
- References
Filter
- All
- Title
- Author
- Author Affiliations
- Full Text
- Abstract
- Keyword
- DOI
- ISBN
- EISBN
- ISSN
- EISSN
- Issue
- Volume
- References
Filter
- All
- Title
- Author
- Author Affiliations
- Full Text
- Abstract
- Keyword
- DOI
- ISBN
- EISBN
- ISSN
- EISSN
- Issue
- Volume
- References
Filter
- All
- Title
- Author
- Author Affiliations
- Full Text
- Abstract
- Keyword
- DOI
- ISBN
- EISBN
- ISSN
- EISSN
- Issue
- Volume
- References
NARROW
Format
Subjects
Journal
Article Type
Issue Section
Date
Availability
1-20 of 11929
Follow your search
Access your saved searches in your account
Would you like to receive an alert when new items match your search?
1
Sort by
Journal Articles
Penile Shear Wave Elastography Can Demonstrate and Classify the Development of Erectile Dysfunction in Patients with Type 1 Diabetes Mellitus: A Prospective Observational Study
Available to PurchaseSubject Area:
Further Areas
Deniz Noyan Ozlu, Yusuf Arikan, Salih Karaca, Aysegul Oz Ozcan, Zeynep Altin, Busra Emir, Hakan Polat, Mehmet Zeynel Keskin
Journal:
Urologia Internationalis
Urol Int (2026)
Published Online: 22 January 2026
Journal Articles
Subject Area:
Further Areas
Katharina Hauner, Jennifer Kranz, Florian M. E. Wagenlehner, Sonja Hansen, Gernot Bonkat, Giuseppe Magistro, Matthias May
Journal:
Urologia Internationalis
Urol Int (2026)
Published Online: 21 January 2026
Journal Articles
Extended versus Standard Docetaxel in Metastatic Hormone-Sensitive Prostate Cancer: A Real-World Cohort Study
Available to PurchaseSubject Area:
Further Areas
Can Aydogdu, Florian Urban, Elena Berg, Melanie Götz, Severin Rodler, Isabel Brinkmann, Benazir Enzinger, Marie Semmler, Frederik Kolligs, Marina Hoffmann, Leo F. Stadelmeier, Thilo Westhofen, Lena M. Unterrainer, Volker Heinemann, Christian G. Stief, Alexander Tamalunas, Jozefina Casuscelli
Journal:
Urologia Internationalis
Urol Int (2026)
Published Online: 19 January 2026
Journal Articles
Comparison of Oncologic and Functional Outcomes of Orifice Resection via Monopolar and Bipolar System in Bladder Tumors with Orifice Involvement
Available to PurchaseSubject Area:
Further Areas
Yusuf Kadir Topcu, Serkan Yarimoglu, Ertugrul Sefik, Serdar Celik, Deniz Bolat, Ibrahim Halil Bozkurt, Bulent Gunlusoy, Tansu Degirmenci
Journal:
Urologia Internationalis
Urol Int (2026)
Published Online: 13 January 2026
Journal Articles
Subject Area:
Further Areas
Journal:
Urologia Internationalis
Urol Int (2026)
Published Online: 08 January 2026
Journal Articles
Who needs a postoperative radiological anastomotic control following radical prostatectomy before catheter removal on postoperative day 3? – Analysis of risk factors predicting anastomotic leakage
Available to PurchaseSubject Area:
Further Areas
Analena Handke, Martina Dellino, Joachim Noldus, Moritz J. Reike, Florian Roghmann, Rein-Jüri Palisaar, Karl H. Tully
Journal:
Urologia Internationalis
Urol Int (2025)
Published Online: 30 December 2025
Journal Articles
Minimally invasive ureteric reimplant: Half a decade experience of laparoscopic versus robotic approaches at a tertiary care centre and review of literature
Available to PurchaseSubject Area:
Further Areas
Aravind T.K., Harshdeep Singh, Niraj Kumar, Anup Kumar, Siddharth Yadav, Ruchi Mittal, Sandeep Kumar, Puneeth Medapati, Biswajeet Sarmah, Pawan Vasudeva
Journal:
Urologia Internationalis
Urol Int (2025)
Published Online: 26 December 2025
Journal Articles
Single-port partial nephrectomy: state of the art and future directions
Available to PurchaseSubject Area:
Further Areas
Journal:
Urologia Internationalis
Urol Int (2025)
Published Online: 26 December 2025
Journal Articles
Subject Area:
Further Areas
Lujza Brunaiova, Karl G. Sommer, Lukas Koneval, Dario Willi, Mirjam N. Mohr, Thomas Neumann, Laila Schneidewind, Annemarie Uhlig
Journal:
Urologia Internationalis
Urol Int (2025)
Published Online: 12 December 2025
Journal Articles
Outpatient versus Inpatient Ureterorenoscopy: A Retrospective Dual-Center Analysis
Available to PurchaseSubject Area:
Further Areas
Maximilian Reinhard Müller, Marco Julius Schnabel, Immanuel Augustin Oppolzer, Christopher Goßler, Maximilian Burger, Mark Thalgott
Journal:
Urologia Internationalis
Urol Int (2025)
Published Online: 11 December 2025
Journal Articles
Conventional Cognitive Freehand versus Software-Supported, Volumetric-Optimized Systematic Ultrasound-Guided Prostate Biopsy: A Head-to-Head Comparison
Available to PurchaseSubject Area:
Further Areas
Journal:
Urologia Internationalis
Urol Int (2025)
Published Online: 25 November 2025
Images
Theoretical difference in the distribution pattern (12 cores) within the or...
Available to Purchase
in Conventional Cognitive Freehand versus Software-Supported, Volumetric-Optimized Systematic Ultrasound-Guided Prostate Biopsy: A Head-to-Head Comparison
> Urologia Internationalis
Published Online: 25 November 2025
Fig. 1. Theoretical difference in the distribution pattern (12 cores) within the organ between the two methods. The prostate is depicted in an axial way with the urethra in the center and the peripheral zone dorsal. Different systematic prostate biopsy patterns between VOT and CFT. More about this image found in Theoretical difference in the distribution pattern (12 cores) within the or...
Images
Selection process of patients finally qualifying for inclusion into study a...
Available to Purchase
in Conventional Cognitive Freehand versus Software-Supported, Volumetric-Optimized Systematic Ultrasound-Guided Prostate Biopsy: A Head-to-Head Comparison
> Urologia Internationalis
Published Online: 25 November 2025
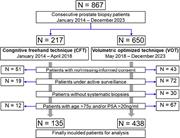
Fig. 2. Selection process of patients finally qualifying for inclusion into study analysis. Study patients inclusion process. More about this image found in Selection process of patients finally qualifying for inclusion into study a...
Journal Articles
The Quantitative Link between Baseline Chronic Kidney Disease and Functional Decline after Minimal Invasive Partial Nephrectomy: A Multicenter Study
Available to PurchaseSubject Area:
Further Areas
Journal:
Urologia Internationalis
Urol Int (2025)
Published Online: 24 November 2025
Images
RCS demonstrating the nonlinear relationships between baseline renal functi...
Available to Purchase
in The Quantitative Link between Baseline Chronic Kidney Disease and Functional Decline after Minimal Invasive Partial Nephrectomy: A Multicenter Study
> Urologia Internationalis
Published Online: 24 November 2025
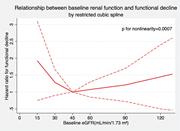
Fig. 1. RCS demonstrating the nonlinear relationships between baseline renal function and postoperative functional percent decline. RCS, restricted cubic spline. More about this image found in RCS demonstrating the nonlinear relationships between baseline renal functi...
Journal Articles
Oncological Outcomes of Patients Undergoing Radical Prostatectomy with Extended versus Indocyanine-Guided Lymphadenectomy: Midterm Follow-Up of PersonalymPCa Clinical Trial
Available to PurchaseSubject Area:
Further Areas
Jose Franklin Anagua Melendres, Pedro de Pablos-Rodríguez, Christian A. Martínez Osorio, Álvaro Gomez-Ferrer Lozano, Manel Beamud Cortés, Ana Calatrava Fons, Jessica Patiño Aliaga, Mario Hassi Román, Víctor Rodríguez Part, Augusto Wong Gutiérrez, Juan Casanova Ramón Borja, Miguel Ramírez Backhaus
Journal:
Urologia Internationalis
Urol Int (2025)
Published Online: 20 November 2025
Images
BCR-free survival.
Available to Purchase
in Oncological Outcomes of Patients Undergoing Radical Prostatectomy with Extended versus Indocyanine-Guided Lymphadenectomy: Midterm Follow-Up of PersonalymPCa Clinical Trial
> Urologia Internationalis
Published Online: 20 November 2025
Fig. 1. BCR-free survival. More about this image found in BCR-free survival.
Images
Secondary treatment-free survival.
Available to Purchase
in Oncological Outcomes of Patients Undergoing Radical Prostatectomy with Extended versus Indocyanine-Guided Lymphadenectomy: Midterm Follow-Up of PersonalymPCa Clinical Trial
> Urologia Internationalis
Published Online: 20 November 2025
Fig. 2. Secondary treatment-free survival. More about this image found in Secondary treatment-free survival.
Journal Articles
Preoperative Role of Systemic Immune Indices in the Differential Diagnosis between Chromophobe Renal Cell Carcinoma and Oncocytoma
Available to PurchaseSubject Area:
Further Areas
Semih Aktaş, Hüseyin Beşiroğlu, Ahmet Halil Sevinç, Muammer Bozkurt, Hüseyin Aytaç Ateş, Mustafa Kadıhasanoğlu
Journal:
Urologia Internationalis
Urol Int (2025)
Published Online: 19 November 2025
Images
ROC analysis for NLR, MLR, PLR, SII, and SIRI. ROC curves showing the di...
Available to Purchase
in Preoperative Role of Systemic Immune Indices in the Differential Diagnosis between Chromophobe Renal Cell Carcinoma and Oncocytoma
> Urologia Internationalis
Published Online: 19 November 2025
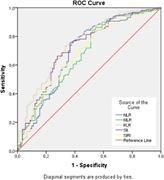
Fig. 1. ROC analysis for NLR, MLR, PLR, SII, and SIRI. ROC curves showing the diagnostic performance of five inflammation-based indices (NLR, MLR, PLR, SII, and SIRI) in distinguishing chromophobe RCC from oncocytoma. More about this image found in ROC analysis for NLR, MLR, PLR, SII, and SIRI. ROC curves showing the di...
1


