Abstract
Introduction: Osseous metastasis is the most common site of distant spread in prostate cancer. Several factors contribute to predicting bone metastasis, including elevated PSA levels, short PSA doubling time, advanced ISUP grading, local tumor progression, and novel biomarkers. However, no clinical scoring system currently exists to assess bone metastasis risk at the time of prostate cancer diagnosis. Furthermore, no study has investigated the correlation between predictive factors and bone sialoprotein (BSP) expression in the primary tumor. Methods: Immunohistochemistry was used to evaluate BSP expression in transrectal ultrasound-guided biopsies from prostate cancer patients. Data from 673 patients were analyzed over a 7–9 year follow-up period to assess the development of bone metastases. BSP expression was also evaluated in patients with benign prostatic hyperplasia (BPH). Additionally, BSP expression was analyzed alongside established risk factors using multivariate logistic regression to determine their combined predictive value for bone metastasis. Results: Bone metastases developed in 12.5% (84/673) of patients. BSP expression was negative (0–5%) in 23.8% of cases, while 22.2% exhibited high expression (>40%). Patients with bone metastases had significantly higher BSP expression than those without (55.5 ± 19.7% vs. 25.7 ± 24.9%; p < 0.001). In contrast, 97% of patients without prostate carcinoma had BSP values below 5%. Among metastatic patients: 82.9% had BSP expression of at least 40%, and none had values below 20%. As a single predictive parameter, BSP showed a sensitivity of 50% and a specificity of 81.6%. However, using multivariate analysis, a three-parameter scoring model integrating BSP expression, ISUP grading, and the number of affected core needle biopsies achieved 88.6% sensitivity and 81.1% specificity for predicting bone metastases. Conclusion: BSP expression serves as a potential indicator for bone metastasis development but lacks sufficient sensitivity as a standalone clinical marker. Similarly, local tumor progression and histopathologic grading (ISUP) fail as single predictors. However, integrating BSP expression with established risk factors significantly enhances predictive accuracy. Given that all three parameters are derived from routine histopathological analysis, BSP immunohistochemistry should be considered for integration into clinical practice for early risk stratification in prostate cancer patients.
Introduction
As life expectancy increases in Western industrialized nations, the incidence of malignant neoplastic diseases continues to rise [1]. Among men, prostate carcinoma is the most frequently diagnosed malignancy, accounting for approximately one in four newly diagnosed cancers. In 2020 alone, 65,820 new cases and 15,403 deaths were reported in Germany, while 1.41 million cases and 375,304 deaths were recorded worldwide [2, 3].
A key prognostic factor in prostate cancer is the presence or absence of metastases at the time of diagnosis. By far, the most common site of metastasis is bone tissue, occurring in up to 80% of patients with advanced-stage prostate carcinoma [4]. Several factors have been associated with an increased risk of bone metastases, including high PSA levels, short PSA doubling time, high pathological grading (ISUP), and local tumor progression [5‒7].
One biomarker suspected to play a central role in bone metastasis formation is bone sialoprotein (BSP). Originally discovered in bovine cortical bone, BSP belongs to the same protein family as osteonectin and osteopontin and constitutes 12% of the total non-collagenous extracellular protein in bone tissue [8, 9]. BSP is involved in apatite crystal deposition and is physiologically expressed in mineralizing cells such as osteoblasts, osteoclasts, osteocytes, chondrocytes, and trophoblasts [10, 11].
Since the early 1990s, the role of BSP in bone metastasis formation has been extensively studied [12‒14]. BSP has been found to be expressed in multiple tumor types that primarily metastasize to bone, including breast cancer [12], lung cancer [13], prostate cancer [14], and cervical cancer [15]. Recent studies using interleukin-8 (IL-8)-manipulated cell cultures demonstrated that BSP upregulation enhances tumor cell adherence to bone tissue [16].
Additionally, structural differences between physiologically produced BSP and tumor-derived BSP enable tumor-specific BSP antibodies to bind and inactivate metastatic BSP. Animal models have shown that the administration of BSP-specific antibodies alongside tumor cells reduces bone metastasis formation [17].
Given these findings, this study aims to evaluate whether BSP expression in prostate carcinoma can predict the development of bone metastases, either as a single parameter or in combination with other known risk factors. Furthermore, we assess the potential integration of BSP immunohistochemistry into routine histopathological diagnostics.
To achieve this, transrectal ultrasound (TRUS)-guided biopsies were analyzed, as histological confirmation of bone metastases is generally not required in clinical practice. The diagnosis of osseous prostate cancer metastases is primarily based on clinical and radiological findings, with histological confirmation only performed in cases of diagnostic uncertainty or multiple malignancies.
Unlike previous studies that focused solely on serum BSP levels [14], our investigation focuses on BSP expression in prostate carcinoma tissue to determine whether it provides a predictive value for bone metastases. Additionally, we examine BSP expression in benign prostate conditions, as no previous studies have evaluated BSP in prostate tissue from patients without carcinoma or within elderly populations.
Materials and Methods
The patient collective consists of 1,201 individuals diagnosed with prostate cancer following TRUS-guided biopsies in the urology unit of the Institute of Pathology, Augusta-Hospital, Bochum, Germany, between 2011 and 2013. At the time of diagnosis, all patients were nonmetastatic. Data on osseous metastases were available for 673 patients after a 7–9-year follow-up.
During the follow-up period, 84 patients (12.5%) developed bone metastases, while 589 patients (87.5%) did not. The mean age in the metastasis group was 72.5 years, compared to 69.8 years in the nonmetastatic group. None of the patients in this cohort were diagnosed with other malignant tumors.
For correlation analysis, BSP expression was also investigated in 30 patients without carcinoma. The sample included 10 patients aged 50–60 years, 10 patients aged 60–70 years, and 10 patients aged 70–80 years. The study was conducted in accordance with ethical guidelines, and approval was obtained from the Institutional Ethics Committee (Medical Faculty of the University Duisburg-Essen, 20-9548-BO).
Three antibodies were tested for reliability and stability. Only one antibody, namely, Linaris (Linaris Biological Products, Dossenheim, Germany) at a 1:1,000 dilution, showed sufficient stability in positive controls on placenta and bone tissue. The other two antibodies yielded unsatisfactory results, even after repeated testing with heat and enzyme pretreatment.
For this study, immunohistochemistry with Linaris (1:1,000 dilution) was applied to the entire patient collective. The reaction was performed manually by a laboratory assistant and automated using a benchmark Ventana device.
Quantification was conducted under a light microscope by two independent observers. The immunohistochemistry and quantification process was repeated for metastatic patients to ensure accuracy of BSP expression.
Any reaction of tumor cells was classified as positive. All tumor cells in the biopsy cylinders were examined, and the percentage of positive tumor cells was calculated. For statistical analysis, BSP expression was categorized as follows:
0–5% BSP expression = BSP-negative tumors
Tumors were further classified into 10 percentile groups (e.g., 5–15%, 15–25%, and 25–35%).
In addition to BSP expression in the primary tumor, other known risk factors were evaluated, including number of affected biopsies, patient age, serum PSA level at the time of core needle biopsy, histopathological grading (ISUP), and tumor stage (TNM system) in patients who underwent radical prostatectomy.
Furthermore, BSP expression in patients without carcinoma but with benign prostatic hyperplasia (BPH) was examined. All variables were analyzed descriptively, including sample size, mean and standard deviation, median and quartiles and range.
Group differences were assessed using the Mann-Whitney U test, with a significance threshold of p < 0.05. Bivariate correlations between variables were analyzed using the non-parametric Spearman’s rho correlation. To evaluate the influence of risk factors, a multiple logistic regression model was applied. Based on these models, easily manageable score-based classification systems were developed.
Results
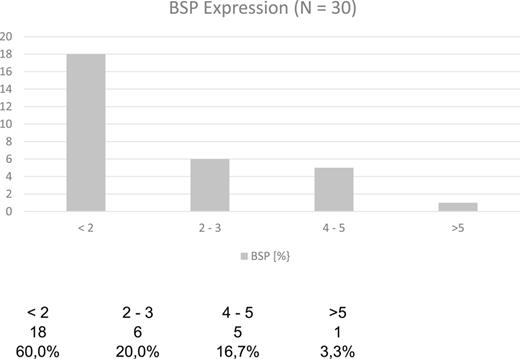
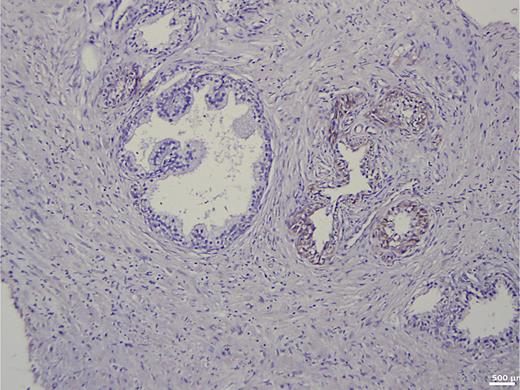
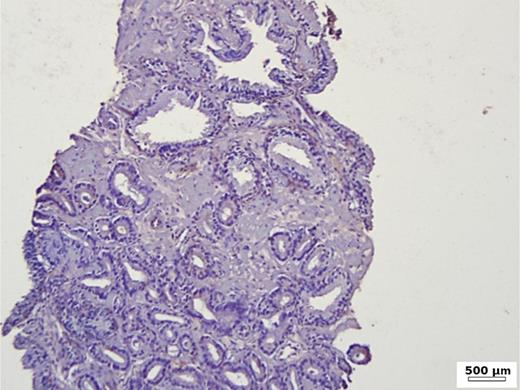
In the group of patients without carcinoma, the vast majority exhibited BSP expression of less than 1%. Twenty-nine out of thirty patients had a value below 5% (Table 1). One patient showed a BSP expression of 9%; however, the expression was observed only in basal cells in a condition of basal cell hyperplasia combined with chronic inflammation (Fig. 1). BSP expression in prostate tissue without carcinoma and without basal cell hyperplasia is shown in Figure 2.
Immunohistochemistry in prostate tissue without carcinoma and with basal cell hyperplasia.
Immunohistochemistry in prostate tissue without carcinoma and with basal cell hyperplasia.
Immunohistochemistry in prostate tissue without carcinoma and without basal cell hyperplasia.
Immunohistochemistry in prostate tissue without carcinoma and without basal cell hyperplasia.
Among the 673 patients with prostate cancer, 12.5% (84/673) developed bone metastases. The metastatic patients were, on average, older than the nonmetastatic patients (p = 0.003, Table 2). Furthermore, there was a statistically significant correlation between BSP expression and age in the nonmetastatic group (N = 567, r = 0.088; pSR = 0.037), whereas no correlation was observed in the metastatic group (N = 82, r = 0.162; pSR = 0.147, Table 3).
Statistically significant difference in age between metastatic (84) and nonmetastatic groups (n = 589, Z = −2, 0.933; pU = 0.003)
| Statistical parameter: age (years) . | ||||||||
|---|---|---|---|---|---|---|---|---|
| group . | N . | mean . | SD . | min . | Q1 . | median . | Q3 . | max . |
| Metastatic | 84 | 72.5 | 7.6 | 51 | 67.0 | 74.0 | 78.0 | 89 |
| Nonmetastatic | 589 | 69.8 | 8.0 | 46 | 65.0 | 71.0 | 75.0 | 92 |
| Statistical parameter: age (years) . | ||||||||
|---|---|---|---|---|---|---|---|---|
| group . | N . | mean . | SD . | min . | Q1 . | median . | Q3 . | max . |
| Metastatic | 84 | 72.5 | 7.6 | 51 | 67.0 | 74.0 | 78.0 | 89 |
| Nonmetastatic | 589 | 69.8 | 8.0 | 46 | 65.0 | 71.0 | 75.0 | 92 |
Non-parametric correlation by Spearman’s rho
| Correlation between BSP (%) and age (years) depending on metastasis . | |||
|---|---|---|---|
| group . | N . | correlation . | p value . |
| Metastatic | 82 | −0.162 | 0.147 |
| Nonmetastatic | 567 | 0.088 | 0.037 |
| Correlation between BSP (%) and age (years) depending on metastasis . | |||
|---|---|---|---|
| group . | N . | correlation . | p value . |
| Metastatic | 82 | −0.162 | 0.147 |
| Nonmetastatic | 567 | 0.088 | 0.037 |
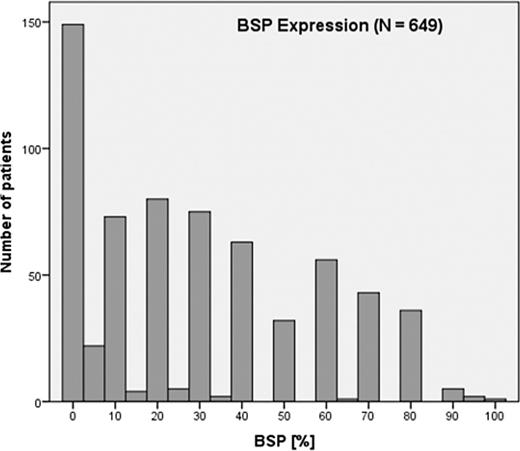
The average BSP expression in the metastatic group was 55.5%, while in the nonmetastatic group, it was 25.7%. This difference was statistically significant (Z = −9.429; pU < 0.001, Table 4). Notably, all patients in the metastatic group had a BSP value of at least 20%, whereas in the nonmetastatic group, 23.8% (135/567) had BSP values between 0 and 5%, and 43.7% (248/567) had BSP values below 20% (Fig. 3). In the entire patient cohort, the BSP expression patterns were the following:
23.8% were BSP-negative (0–5% expression).
22.2% had high BSP expression (>40%).
82.9% of metastatic patients exhibited BSP expression of at least 40%.
No metastatic patient had BSP values below 20%.
Statistical parameters of bone sialoprotein expression (BSP) (Z = −9.429; pU < 0.001)
| Statistical parameter: BSP, % . | ||||||||
|---|---|---|---|---|---|---|---|---|
| group . | N . | mean . | SD . | min . | Q1 . | median . | Q3 . | max . |
| Metastatic | 82 | 55.5 | 19.7 | 20 | 40.0 | 55.0 | 70.0 | 95 |
| Nonmetastatic | 567 | 25.7 | 24.9 | 0 | 1.0 | 20.0 | 40.0 | 100 |
| Statistical parameter: BSP, % . | ||||||||
|---|---|---|---|---|---|---|---|---|
| group . | N . | mean . | SD . | min . | Q1 . | median . | Q3 . | max . |
| Metastatic | 82 | 55.5 | 19.7 | 20 | 40.0 | 55.0 | 70.0 | 95 |
| Nonmetastatic | 567 | 25.7 | 24.9 | 0 | 1.0 | 20.0 | 40.0 | 100 |
These results are summarized in Table 4 and Figures 3 and 5. To avoid bias, calculations were repeated after excluding all nonmetastatic patients with BSP values below 20%, and the results were confirmed. The difference in BSP expression remained statistically significant (Z = −5.054; pU < 0.001, Table 5). Using BSP as a single predictive parameter with a cutoff value of 50%, the model achieved the following (Table 6):
Sensitivity: 50% (correctly predicting 41/82 metastatic patients).
Specificity: 81.6% (correctly predicting 464/567 nonmetastatic patients).
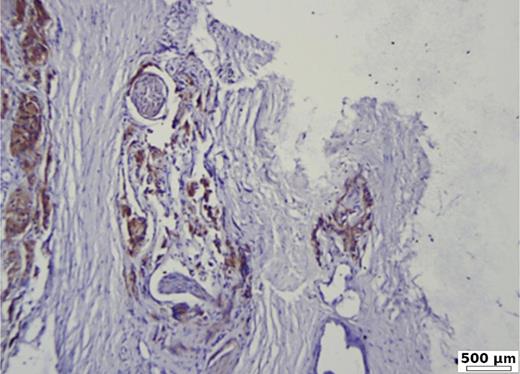
Strong BSP expression of 90% in poorly differentiated prostate carcinoma (G3, ISUP 5), with capsular and perineural invasion. Immunohistochemistry BSP.
Strong BSP expression of 90% in poorly differentiated prostate carcinoma (G3, ISUP 5), with capsular and perineural invasion. Immunohistochemistry BSP.
Low BSP expression (20%) in a moderate differentiated acinar prostate carcinoma (G2, ISUP 2). Immunohistochemistry BSP.
Low BSP expression (20%) in a moderate differentiated acinar prostate carcinoma (G2, ISUP 2). Immunohistochemistry BSP.
Statistical parameters for BSP expression of ≥20% (Z = −5.054; pU < 0.001)
| Statistical parameter: BSP, minimum 20%, % . | ||||||||
|---|---|---|---|---|---|---|---|---|
| group . | N . | mean . | SD . | min . | Q1 . | median . | Q3 . | max . |
| Metastatic | 82 | 55.5 | 19.7 | 20 | 40.0 | 55.0 | 70.0 | 95 |
| Nonmetastatic | 319 | 42.8 | 20.3 | 20 | 25.0 | 40.0 | 60.0 | 100 |
BSP as a single parameter
| . | Sensitivity . | Specificity . | ||
|---|---|---|---|---|
| BSP | N = 82 | 50.0% | N = 567 | 81.6% |
| . | Sensitivity . | Specificity . | ||
|---|---|---|---|---|
| BSP | N = 82 | 50.0% | N = 567 | 81.6% |
Sensitivity and specificity using logistic regression.
These findings suggest that BSP alone is insufficient as a predictive factor. Therefore, additional risk factors and their correlations were analyzed.
Most patients (84.5%) presented with clinically advanced tumors (pT3a or pT3b, Table 7). Additionally, 83.3% of metastatic patients had high-grade carcinomas (ISUP groups 4 or 5). Even among less advanced tumors (pT2b or pT2c), the majority (69.3%) were classified as ISUP group 4 or 5 (Table 8).
Frequency distribution of TNM classification
| . | Total . | pT2b . | pT2c . | pT3a . | pT3b . | ||||
|---|---|---|---|---|---|---|---|---|---|
| N . | N . | % . | N . | % . | N . | % . | N . | % . | |
| Patients with metastasis | 84 | 3 | 3.6 | 10 | 11.9 | 59 | 70.2 | 12 | 14.3 |
| . | Total . | pT2b . | pT2c . | pT3a . | pT3b . | ||||
|---|---|---|---|---|---|---|---|---|---|
| N . | N . | % . | N . | % . | N . | % . | N . | % . | |
| Patients with metastasis | 84 | 3 | 3.6 | 10 | 11.9 | 59 | 70.2 | 12 | 14.3 |
For all patients without metastasis, the TNM classification is not known.
Frequency distribution of risk factor ISUP depending on the TNM classification
| TNM . | ISUP 2/3 . | ISUP 4/5 . | ||
|---|---|---|---|---|
| N . | % . | N . | % . | |
| pT2b/pT2c | 4 | 30.8 | 9 | 69.2 |
| pT3a | 9 | 15.3 | 50 | 84.7 |
| pT3b | 1 | 8.3 | 11 | 91.7 |
| Total | 14 | 16.7 | 70 | 83.3 |
| TNM . | ISUP 2/3 . | ISUP 4/5 . | ||
|---|---|---|---|---|
| N . | % . | N . | % . | |
| pT2b/pT2c | 4 | 30.8 | 9 | 69.2 |
| pT3a | 9 | 15.3 | 50 | 84.7 |
| pT3b | 1 | 8.3 | 11 | 91.7 |
| Total | 14 | 16.7 | 70 | 83.3 |
The study did not demonstrate a correlation between tumor stage and BSP expression (Table 9). However, an analysis of serum PSA levels at the time of core needle biopsy revealed a significant correlation between PSA levels, disease progression, and tumor burden (Table 10).
Statistical parameter: BSP (%)
| TNM classification . | N . | Mean . | SD . | Min . | Median . | Max . |
|---|---|---|---|---|---|---|
| pT2b | 3 | 83.3 | 28.9 | 30 | 80.0 | 80 |
| pT2c | 10 | 66.0 | 19.0 | 30 | 70.0 | 90 |
| pT3a | 58 | 54.2 | 19.2 | 20 | 50.0 | 95 |
| pT3b | 11 | 50.5 | 20.1 | 20 | 50.0 | 80 |
| Total | 82 | 55.6 | 19.7 | 20 | 55.0 | 95 |
Initial PSA
| TNM_q . | N . | Mean . | SD . | Minimum . | Median . | Maximum . |
|---|---|---|---|---|---|---|
| pT2c | 4 | 9.1750 | 3.31298 | 5.30 | 9.0000 | 13.40 |
| pT3a | 28 | 14.5461 | 7.39731 | 5.91 | 12.5000 | 36.00 |
| pT3b | 4 | 24.7075 | 8.03942 | 16.50 | 23.4650 | 35.40 |
| Total | 36 | 15.0783 | 7.96866 | 5.30 | 12.9500 | 36.00 |
A comparison of the last recorded PSA level versus the initial PSA value showed a 200-fold increase in serum PSA levels in patients with pT3a tumors (Table 11). Additionally, the number of affected biopsies served as a strong indicator of local tumor progression and a risk factor for bone metastasis. The difference between metastatic and nonmetastatic tumors was significant:
Metastatic tumors: 74.1% affected biopsies.
Nonmetastatic tumors: 47.4% affected biopsies.
PSA_last
| TNM_q . | N . | Mean . | SD . | Minimum . | Median . | Maximum . |
|---|---|---|---|---|---|---|
| pT2c | 4 | 31.8975 | 39.86543 | 6.99 | 14.8000 | 91.00 |
| pT3a | 25 | 298.8789 | 502.27537 | 0.08 | 110.0000 | 2,275.00 |
| pT3b | 3 | 116.9033 | 165.41907 | 4.20 | 39.7000 | 306.81 |
| Total | 32 | 248.4460 | 454.98310 | 0.08 | 88.7000 | 2,275.00 |
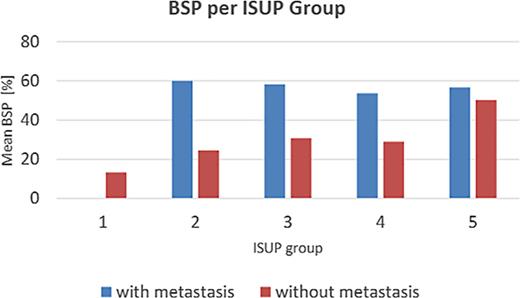
These results are presented in Table 12. The relationship between ISUP grading and BSP expression is illustrated in Table 13 and Figure 6:
In the nonmetastatic group, BSP expression correlated significantly with ISUP grade (r = 0.329; pSR < 0.001).
In the metastatic group, no correlation was found (r = 0.011; pSR = 0.919).
Mean BSP values per ISUP group further illustrate this trend.
Statistical parameter: number of affected core needle biopsies in relation to number of collected biopsies (%)
| Group . | N . | Mean . | SD . | Min . | Q1 . | Median . | Q3 . | Max . |
|---|---|---|---|---|---|---|---|---|
| Mm | 81 | 74.1 | 26.6 | 7.7 | 50.0 | 77.8 | 100.0 | 100.0 |
| Mo | 586 | 47.4 | 28.6 | 8.3 | 25.0 | 41.7 | 66.7 | 100.0 |
| Group . | N . | Mean . | SD . | Min . | Q1 . | Median . | Q3 . | Max . |
|---|---|---|---|---|---|---|---|---|
| Mm | 81 | 74.1 | 26.6 | 7.7 | 50.0 | 77.8 | 100.0 | 100.0 |
| Mo | 586 | 47.4 | 28.6 | 8.3 | 25.0 | 41.7 | 66.7 | 100.0 |
Distribution in metastatic and nonmetastatic group.
BSP expression in relation to ISUP group
| BSP – value, % . | ||||||
|---|---|---|---|---|---|---|
| ISUP group . | Mm group . | Mo group . | ||||
| N . | mean (SD) . | median . | N . | mean (SD) . | median . | |
| 1 | - | | | 149 | 13.4 (17.6) | 5.0 |
| 2 | 1 | 60.0 (−) | 60.0 | 108 | 24.5 (23.9) | 20.0 |
| 3 | 11 | 58.2 (21.4) | 60.0 | 136 | 30.8 (25.5) | 22.5 |
| 4 | 40 | 53.8 (21.1) | 50.0 | 139 | 29.1 (23.6) | 30.0 |
| 5 | 30 | 56.7 (18.0) | 55.0 | 34 | 50.3 (30.2) | 65.0 |
Using logistic regression, the predictive value of several parameters for bone metastasis formation was analyzed (Table 14):
Initial serum PSA level at core needle biopsy: sensitivity 58.1%
Number of affected biopsies: sensitivity 50.6%
BSP expression alone: sensitivity 50.0%
ISUP histopathological grading: shows despite a low sensitivity the highest specificity in predicting nonmetastatic patients, since none of the patients with well-differentiated carcinoma developed metastases. Using a two-factor model (Table 15), the model achieved the following:
BSP expression + number of affected biopsies → sensitivity 81.0%.
BSP expression + initial PSA level → sensitivity 61.1% (failed to provide strong predictive power).
Multivariance analysis using logistic regression for single parameters
| Parameter . | Sensitivity . | Specificity . | ||
|---|---|---|---|---|
| BSP | N = 82 | 50.0% | N = 567 | 81.6% |
| ISUP group | N = 84 | 35.7% | N = 588 | 94.0%1 |
| Affected core needle biopsies | N = 81 | 50.6% | N = 588 | 81.2% |
| Initial serum PSA | N = 74 | 58.1% | N = 587 | 93.9% |
| Parameter . | Sensitivity . | Specificity . | ||
|---|---|---|---|---|
| BSP | N = 82 | 50.0% | N = 567 | 81.6% |
| ISUP group | N = 84 | 35.7% | N = 588 | 94.0%1 |
| Affected core needle biopsies | N = 81 | 50.6% | N = 588 | 81.2% |
| Initial serum PSA | N = 74 | 58.1% | N = 587 | 93.9% |
Multivariance analysis with logistic regression using 2 parameters
| Parameter . | Sensitivity . | Specificity . | ||
|---|---|---|---|---|
| BSP and ISUP | N = 82 | 80.5% | N = 566 | 82.9% |
| BSP and number of affected core needle biopsies | N = 79 | 81.0% | N = 566 | 81.4% |
| BSP, initial serum PSA | N = 72 | 61.1% | N = 565 | 81.1% |
| Parameter . | Sensitivity . | Specificity . | ||
|---|---|---|---|---|
| BSP and ISUP | N = 82 | 80.5% | N = 566 | 82.9% |
| BSP and number of affected core needle biopsies | N = 79 | 81.0% | N = 566 | 81.4% |
| BSP, initial serum PSA | N = 72 | 61.1% | N = 565 | 81.1% |
By combining three key risk factors – BSP expression, number of affected biopsies, and ISUP grading – a scoring system was developed (Table 16).
A maximum score of 9 was assigned.
A score <5 indicated low risk, while ≥5 indicated high risk.
Using a cutoff score of 5, the model achieved the following:
- -
Sensitivity: 88.6% (70/79 metastatic patients identified).
- -
Specificity: 80.0% (458/565 nonmetastatic patients correctly classified).
- -
Multivariance analysis with logistic regression using 3 score
| Score . | BSP, % . | ISUP . | Ratio affected/collected specimen, % . |
|---|---|---|---|
| 0 | 0–20 | 1 | 0–50 |
| 1 | 21–35 | 2–3 | 50<75 |
| 2 | 36–60 | 4 | 75<95 |
| 3 | >61 | 5 | 95–100 |
| Score . | BSP, % . | ISUP . | Ratio affected/collected specimen, % . |
|---|---|---|---|
| 0 | 0–20 | 1 | 0–50 |
| 1 | 21–35 | 2–3 | 50<75 |
| 2 | 36–60 | 4 | 75<95 |
| 3 | >61 | 5 | 95–100 |
3 parameter score system: BSP, ISUP, affected specimen. <5 low risk for bone metastasis formation. = />5 high risk for bone metastasis formation.
Discussion
BSP plays a key role in the pathogenesis of osseous metastases. BSP expression has been demonstrated in several malignancies with a known tropism for bone metastases, including lung cancer [18], cervical cancer [15], breast cancer [12], and prostate cancer [14]. However, to the best of our knowledge, no study has explicitly established a correlation between BSP expression and the occurrence of osseous metastases in prostate cancer patients.
In our study, immunohistochemical staining of paraffin-embedded tissue samples was used to assess BSP expression, following methodologies similar to those employed by other authors [14, 15]. Furthermore, a recent in vitro study from 2019 [19] demonstrated that IL-8 upregulates BSP expression, increasing the adherence of prostate carcinoma cells to bone tissue. Their findings showed a significant reduction in cell adherence to bone following treatment with IL-8-specific antibodies.
In our analysis of prostate tissue from carcinoma-free patients, 29 out of 30 individuals (96.7%) exhibited BSP expression below 5%, which was classified as BSP-negative for statistical purposes. Among prostate cancer patients, 23.8% also had BSP-negative values (0–5%).
A study from 2013 [20] is the only known research comparing serum BSP levels between carcinoma patients and those with BPH. Their findings showed that serum BSP levels were significantly higher in prostate cancer patients with bone metastases than in those without metastases, as well as in BPH patients and healthy controls.
One of the most relevant comparisons is a study conducted in 1998 [14], which examined histological samples from 180 patients with localized prostate cancer and correlated BSP expression with clinical and biochemical parameters (Gleason score, PSA levels, and capsular rupture). Their study found immunohistochemical BSP expression in 78.9% of cases, concluding that increased BSP expression in the primary tumor is associated with a higher risk of osseous metastases and tumor progression. However, no specific cutoff value was determined.
Similarly, in our study, 76.2% of patients exhibited BSP expression in tumor cells, aligning with the previously described findings. Importantly, the authors used prostate tissue obtained after radical prostatectomy, whereas our study analyzed TRUS-guided biopsy samples at the time of initial diagnosis. Despite the differences in methodology and sample size (673 patients in our study versus 180 in 1998’s study), the slight variation in BSP positivity rates further supports the robustness of immunohistochemical staining techniques in both studies.
BSP as a Predictor of Bone Metastasis
Our study provides strong evidence that BSP expression correlates with the development of bone metastases in prostate cancer, notably:
All patients with bone metastases had BSP expression of at least 20%.
None of the metastatic patients had BSP-negative tumors (0–5%).
BSP expression in metastatic tumors varied between 20 and 80%.
Over a 7–9-year follow-up period, no patient with a BSP expression below 20% at the time of initial biopsy developed bone metastases, highlighting BSP’s potential as a prognostic biomarker. The classification model of BSP expression varies across studies. For example, the authors of 1998’s study [14] reported that 78.9% of prostate carcinoma patients had detectable BSP expression, with low or no expression in adjacent normal glandular tissue findings that align with our results.
Reference [11] categorized BSP expression based on staining intensity (0, 1+, 2+, 3+) and the percentage of positive neoplastic glands. They divided patients into two groups: low BSP expression (0, 1+) and high BSP expression (2+, 3+) and found that high BSP expression correlated with an increased risk of PSA relapse. In contrast, our study classified BSP expression into 10-percentile increments (0–10%, 10–20%, 20–30%, etc.), allowing for a more granular analysis of expression patterns.
Development of a Predictive Scoring Model
Identifying patients at increased risk of developing bone metastases at the time of initial diagnosis is crucial for optimizing follow-up strategies and initiating early treatment. While BSP expression alone does not achieve sufficiently high sensitivity, its combination with other known risk factors enhances predictive accuracy.
Using a multivariate analysis, we developed a three-parameter scoring system incorporating: BSP expression in the primary tumor, number of affected core needle biopsies, and ISUP grading. This model achieves the following:
Sensitivity: 88.6% for predicting bone metastasis development in the years following initial prostate cancer diagnosis.
High specificity of 81.1% for predicting which patient will not develop bone metastasis in the years following initial prostate cancer diagnosis.
Conclusion
Our study provides the largest patient dataset (N = 673) assessing BSP expression at the time of first prostate cancer diagnosis using TRUS-guided biopsies. It is the first to establish a strong correlation between BSP expression and bone metastases in a large, well-characterized patient cohort.
BSP can serve as an indicator for the development of bone metastases in prostate cancer. While it demonstrates high specificity (81.6%), its sensitivity (50%) is insufficient for BSP to be used as a standalone predictive marker in clinical practice. Similarly, other known risk factors, such as local tumor progression and histopathologic grading (ISUP), also fail to provide sufficient predictive value when considered independently. However, by applying multivariate logistic regression analysis, we developed a three-parameter scoring system that combines the following:
- (1)
BSP expression in the primary tumor.
- (2)
Extent of local tumor progression (affected core needle biopsies).
- (3)
Histopathologic grading (ISUP classification).
This combined approach enables the detection of 88.6% of patients who will develop bone metastases following their initial prostate carcinoma diagnosis via core needle biopsy. Since all three parameters are derived from standard histopathological analysis, these findings highlight the potential integration of BSP immunohistochemistry into routine clinical practice. Further studies and clinical validation are warranted to assess its practical application in risk stratification and treatment planning for prostate cancer patients.
Acknowledgments
The authors thank all participating urologists for the sharing of clinical data.
Statement of Ethics
The vote of the Institutional Ethics Committee (September 29th, 2020, University Duisburg-Essen, No. 20-9548-BO) has been obtained before the start of the study. In correspondence with the decision of the Ethics Committee, the evaluation of the data was anonymized and only retrospective data have been used. Thus, written consent was not needed. The study was conducted in accordance with the World Medical Association and Declaration of Helsinki. The decision of the Ethics Committee is attached.
Conflict of Interest Statement
The authors have no conflicts of interest to declare.
Funding Sources
There was no funding of this study.
Author Contributions
Christos Philippou: conceptualization, writing, visualization, methodology, data curation, supervision, validation, investigation, resources, review, and editing; Simon Gloger, Burkhard Ubrig, and Andreas Wiedemann: investigation, resources, review, and editing; Norman Bitterlich and Emilia Krassimirova Naseva: methodology, review, editing, statistical evaluation, and visualization; Hans-Joerg Sommerfeld: investigation, resources, review, and editing; Dirk Theegarten: conceptualization, methodology, investigation, review, editing, validation, and project administration; Haji Abdulla: investigation, review, and editing; Stathis Philippou: conceptualization, methodology, project administration, investigation, writing, validation, supervision, formal analysis, resources, review, and editing;
Data Availability Statement
All data generated or analyzed during this study are included in this article. Further inquiries can be directed to the corresponding author.


