Abstract
Introduction: The aim of the study was to examine 5-year overall survival (OS) of upper urinary tract urothelial carcinoma (UTUC) patients versus age- and sex-matched population-based controls. Methods: Within Surveillance, Epidemiology, and End Results database (2004–2020), we identified newly diagnosed (2004–2015) UTUC patients. Relying on Social Security Administration Life Tables (2004–2020), age- and sex- matched population-based controls were simulated (Monte Carlo simulation). Results: Of 10,140 UTUC patients, 3,984 (39%) exhibited localized, 4,904 (49%) locally advanced, and 1,252 (12%) metastatic stages. At 5 years of follow-up, the OS rate was 41 versus 78% (Δ 37%) in UTUC patients versus controls. According to stage, OS difference was greatest in metastatic stage (4 vs. 75%; Δ 71%), followed by locally advanced (36 vs. 78%; Δ 42%) and localized stages (58 vs. 78%; Δ 20%). At 5 years of follow-up, the CSM rate was 44%, and the OCM rate was 16%. According to stage, CSM and OCM rates were 88 and 7% in metastatic, 49 and 15% in locally advanced, and 22 and 19% in localized stage UTUC patients. Conclusion: UTUC patients may experience worse OS compared to population-based controls. The most pronounced differences in the 5-year OS were recorded in metastatic and locally advanced stages, suggesting a potentially substantial impact of UTUC on patients’ life expectancy.
Introduction
Upper urinary tract urothelial carcinoma (UTUC) represents a malignancy with poor prognosis [1‒5]. In particular, tumor-related factors such as stage at presentation are crucial prognostic factors for estimation of disease-specific survival in UTUC patients [5‒9]. Although it is well established that metastatic UTUC diagnosis as well as locally advanced UTUC diagnosis, respectively, carry dismal and poor prognoses, it is unknown to what extent such diagnoses undermine patients’ life expectancy relative to that of population-based controls. Moreover, it is also unknown what proportions of overall deaths are attributable to UTUC versus other causes across all three UTUC stages, namely, metastatic, locally advanced, and localized.
We addressed these knowledge gaps. Specifically, we hypothesized that pronounced differences in overall survival (OS) rates exist between UTUC patients and their age- and sex-matched population-based controls. Additionally, we also postulated that these differences are less pronounced in patients with localized and locally advanced stage than in their counterparts with metastatic stage. Finally, we hypothesized that the majority of deaths is related to UTUC (cancer-specific mortality) across all stages. To test these hypotheses, we relied on both the Surveillance, Epidemiology, and End Results (SEER 2004–2020) database to identify UTUC patients and the US Social Security Administration (SSA) Life Tables to simulate age- and sex-matched population-based controls [10].
Materials and Methods
Data Source and Study Population
The SEER database provides information on cancer statistics covering approximately 47.9% of the US population [11]. Within the SEER database (2004–2020), we identified newly diagnosed (2004–2015) and histologically confirmed UTUC (International Classification of Diseases [ICD-10] site codes C65 and C66) patients across all stages. Only patients aged at least 18 years with known vital status, known cause of death, and known stage were included. Autopsy-only cases (n = 2) were excluded. Due to the anonymously coded design of the SEER database, study-specific Institutional Review Board ethics approval was not required. The study has been conducted in accordance with the principles set in the Helsinki Declaration.
Study Endpoints
The primary endpoint of the study represented OS, which is defined as the survival after taking all causes of death into account. Secondary endpoints consisted of cancer-specific mortality (CSM), defined as death from UTUC, and other-cause mortality (OCM), defined as death due to any cause except for mortality from UTUC in accordance with the SEER mortality code.
Statistical Analyses
First, baseline characteristics of UTUC patients were tabulated. Descriptive statistics included medians and interquartile ranges for continuously coded variables and frequencies and proportions for categorical variables. Second, relying on the principles of Monte Carlo simulation, an age- and sex-matched population-based control was simulated through a one-to-one matching process for each UTUC patient, according to previously described methodology [12‒18]. Additionally, a Markov chain representing the natural progression of age was constructed for each age- and sex-matched control. Subsequently, OS of the age- and sex-matched population-based controls was computed based on US SSA Life Tables-derived estimates for survival probability at 5 years of follow-up [10]. The latter will be referred to as “controls.” Third, Kaplan-Meier plots depicted OS of UTUC patients versus corresponding controls. Furthermore, smoothed cumulative incidence plots displayed CSM and OCM of UTUC patients. All statistical analyses were first performed in the entire cohort of UTUC patients and were subsequently repeated in stage-specific fashion (localized vs. locally advanced vs. metastatic stage).
Statistical tests were two sided with a level of significance set at p < 0.05. R software environment was used for statistical computing and graphics (R version 4.2.2; R Foundation for Statistical Computing, Vienna, Austria) [19].
Results
Descriptive Characteristics of UTUC Patients
Within the SEER database (2004–2020), we identified 10,140 patients newly diagnosed with UTUC between 2004 and 2015. Of those, 3,984 (39%) exhibited localized stage, 4,904 (49%) exhibited locally advanced stage, and 1,252 (12%) exhibited metastatic stage (Table 1). In the overall cohort, median age was 74 years (interquartile range 65–80 years), and 5,767 (57%) patients were male.
OS in the Entire Cohort of UTUC Patients versus Controls
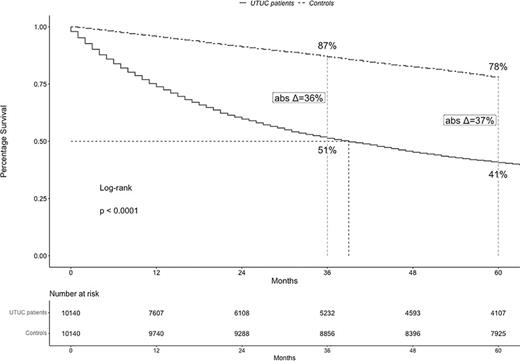
In the entire cohort of 10,140 UTUC patients, median OS was 39 months and 5-year OS rate was 41% (Fig. 1). In simulated controls, corresponding median OS was not reached, and 5-year OS rate was 78%. The resulting 5-year absolute difference in OS rates between UTUC patients versus controls (Δ) was 37%.
OS in UTUC Patients versus Controls, according to Stage
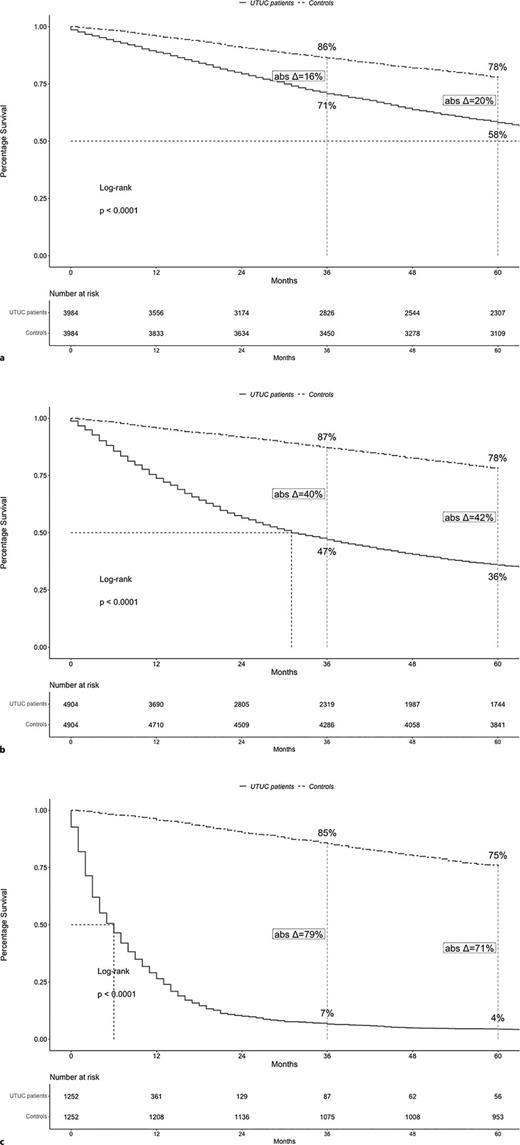
According to stage, median OS value were 82 months in localized stage, 31 months in locally advanced stage, and 6 months in metastatic stage UTUC patients (Fig. 2a–c). Five-year OS rates were 58% in localized stage, 36% in locally advanced stage, and 4% in metastatic stage UTUC patients. In simulated controls that were generated for purpose of comparison with either localized or locally advanced, or metastatic UTUC patients, median OS values were all not reached. Corresponding, OS rates were 78%, 78%, and 75%, respectively in controls that were simulated for subsequent comparisons with localized, locally advanced, and metastatic UTUC patients at 5 years of follow-up. The resulting 5-year absolute differences in OS rates between UTUC patients versus controls (Δ) were 20% for localized stage versus 42% for locally advanced stage versus 71% for metastatic stage.
Cancer-Specific and Other-Cause Mortality in the Entire Cohort of UTUC Patients
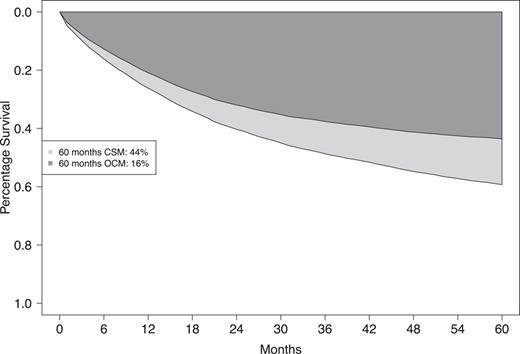
In the entire cohort of UTUC patients, 5-year CSM rate was 44% and 5-year OCM rate was 16% (Fig. 3). Of all deaths recorded at 5 years of follow-up, 73% were cancer-specific in the overall UTUC cohort.
Cancer-Specific and Other-Cause Mortality in UTUC Patients, according to Stage
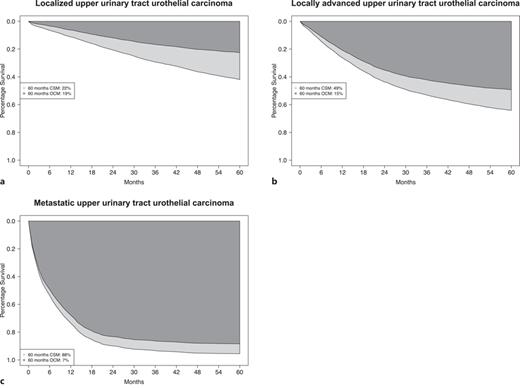
According to stage, 5-year CSM rates were 22% in localized stage, 49% in locally advanced stage, and 88% in metastatic stage UTUC patients (Fig. 4a–c). Five-year OCM rates were 19% in localized stage, 15% in locally advanced stage, and 7% in metastatic stage UTUC patients. Of all deaths recorded at 5 years of follow-up, 54% were cancer-specific in localized stage, 77% were cancer-specific in locally advanced stage, and 93% were cancer-specific in metastatic stage.
Discussion
The extent to which the diagnosis of UTUC affects life expectancy is unknown. To address this knowledge gap, we examined and quantified the differences in 5-year OS between UTUC patients and their age- and sex-matched population-based controls across all UTUC stages. Moreover, we examined what proportion of deaths may be attributed to UTUC (CSM) and what proportion of deaths is unrelated to UTUC (OCM). We made several noteworthy observations.
First, UTUC is a rare cancer [1, 20]. Although UTUC has previously been addressed in some large-scale epidemiologic reports, few of those included UTUC patients across all stages [4, 5, 9, 21, 22]. Conversely, other analyses that relied on multi-institutional databases included considerably lower numbers of UTUC patients [2, 23]. Thus, we relied on one of the largest cohorts of UTUC patients in the current analyses. Specifically, we identified 10,140 UTUC patients across all stages over a 12-year period (2004–2015). Of all UTUC patients, 3,984 (39%) exhibited localized stage, 4,904 (49%) exhibited locally advanced stage, and 1,252 (12%) exhibited metastatic stage. These proportions of stage distribution are comparable to previous studies addressing UTUC [3, 5, 9, 21]. However, to the best of our knowledge, no previous study quantified the extent to which the diagnosis of UTUC affects life expectancy compared to population-based controls, as done in the current study.
Second, we assessed OS in the entire cohort of 10,140 UTUC patients. Subsequently, we repeated all analyses in stage-specific fashion: localized versus locally advanced versus metastatic stage. In the entire cohort of UTUC patients, median OS was 39 months in Kaplan-Meier survival analyses. In stage-specific analyses, metastatic UTUC patients exhibited the worst survival (median OS 6 months), followed by locally advanced patients (median OS 31 months) and localized patients (median OS 82 months). The OS rates recorded in UTUC patients within the current analysis, that relied on the SEER database, validate previous survival analyses that used other large-scale North American databases, such as the National Cancer Database (NCDB) [24, 25], as well as on European national cancer registries [3, 22]. Therefore, the current study cohort of UTUC patients within the SEER database appears highly suitable for further analyses comparing the life expectancy of UTUC patients with controls.
Third, we simulated 5-year OS of age- and sex-matched population-based controls for the entire cohort of UTUC patients, relying on the principles of Monte Carlo simulation methodology, Markov chain of natural progression as well as US SSA Life Tables. Subsequently, we repeated the simulation of controls for localized stage, locally advanced stage, and metastatic stage UTUC patients. Five-year OS rates for the above-simulated controls ranged from 75% for controls simulated for purpose of subsequent comparison with metastatic stage UTUC patients to 78% for controls simulated for purpose of subsequent comparison with localized and locally advanced stage UTUC patients. Observed 5-year OS rates of controls simulated within the current study reflect age and sex characteristics of the respective UTUC patients that determine the composition of all control groups used in the current study.
Fourth, we compared and quantified differences in OS between UTUC patients and their corresponding simulated population-based controls. At 5 years of follow-up, OS rates were 41% for the entire cohort of UTUC patients versus 78% for controls. These observations indicate that newly diagnosed UTUC patients across all stages experience a decrease of life expectancy of 37%. In stage-specific analyses, the greatest decrease in life expectancy was recorded in metastatic stage (4 vs. 75%; Δ 71%), followed by locally advanced stage (36 vs. 78%, Δ 42%) and localized stage patients (58 vs. 78%, Δ 20%). Taken together, these findings do not only validate our hypothesis that a considerable amount of life expectancy is lost at initial UTUC diagnosis. They further validate our hypothesis that the loss of life expectancy is predominantly dependent on UTUC stage at presentation. Based on their novelty, the currently reported observations cannot be directly compared to any previous study since no such study addressed UTUC patients. However, the magnitude of life expectancy decrease in the present cohort of UTUC patients is virtually the same as the life expectancy decrease experienced by newly diagnosed patients with urothelial carcinoma of the urinary bladder (UCUB) [13, 14]. For example, in metastatic stage UCUB patients the decrease in life expectancy at 5 years of follow-up was 77% (vs. 71% in the current study) and 21% in localized stage UCUB patients undergoing radical cystectomy (vs. 20% in the current study). These observations provide a first controlled comparison of life expectancy decrements between UTUC and UCUB patients. They indicate that a controlled comparison results in virtually the same results regarding life expectancy decrease. Conversely, uncontrolled comparisons previously suggested higher mortality rates when stage for stage comparisons between UTUC and UCUB were made [4, 22].
In the final step of the analyses, we relied on smoothed cumulative incidence plots to tabulate CSM as well as OCM rates and quantify to what extent the differences in OS are attributable to UTUC-related mortality (CSM). In the entire cohort of UTUC, the 5-year CSM rate was 44%, and the 5-year OCM rate was 16%. According to stage, the highest 5-year CSM rate of 88% was recorded in metastatic stage, followed by 49% in locally advanced stage, and 22% in localized stage UTUC patients. Five-year OCM rates ranged from 7% in metastatic stage to 15% in locally advanced stage, and 19% in localized UTUC patients. In consequence, the proportion of deaths as direct consequence of UTUC ranged from 93% in metastatic stage to 77% in locally advanced stage to 54% in localized stage UTUC patients. It is noteworthy that in the entire cohort of UTUC patients as well as across all stages, namely, localized, locally advanced, and metastatic, the majority of deaths, and thus, also the differences in OS, may be attributed to UTUC (CSM). In contrast, OCM plays a minor role in UTUC patients, especially in metastatic stage. In a comparison between localized stage UTUC and localized stage UCUB patients treated with radical cystectomy the proportions of deaths attributable to cancer were also virtually the same. At 5 years of follow-up, these were 22% for UTUC in the current study versus 24% for UCUB [14]. Similarly, in a comparison between metastatic stage UTUC and metastatic stage UCUB the proportions of deaths attributable to cancer were 88% in the current study versus 87% for UCUB [13]. These observations further validate the notion that the treated natural history of UTUC is comparable to UCUB.
Taken together, our observations quantifying differences in 5-year OS of UTUC patients versus their age- and sex-matched population-based controls are of great clinical and epidemiological importance. First, they enable patients and clinicians to assess the potential effect of newly diagnosed UTUC on patients’ life expectancy. Second, the current results also indicate that the differences in OS of UTUC patients compared to their controls are primarily attributable to the diagnosis of UTUC (CSM).
Despite its novelty, the present study has limitations. First and foremost, the current study shares the limitations of all UTUC studies that relied on an observational study design and a retrospective database, such as the SEER or the NCDB [4, 5, 8, 9, 21, 24‒27]. However, retrospective databases, such as the SEER or the NCDB represent valuable opportunities to study rare cancers with robust statistical conclusions. Second, due to the rarity of UTUC, the sample size within the SEER database is limited despite the large scale of the SEER database. Third, the control group consisted of a simulated age- and sex-matched population-based cohort, in whom OS was defined according to US SSA Life Tables predictions. Although this methodology is well established [12‒18, 28‒30], it only represents a surrogate for true population-based controls. Additionally, since US SSA Life Tables only provide information regarding age and sex, adjustments for other patient characteristics, such as race/ethnicity, could not be made. Moreover, US SSA Life Tables derived data do not provide a specific cause of death [10]. In consequence, the comparison between UTUC patients and controls can only be based on OS.
Conclusions
UTUC patients may experience worse OS compared to age- and sex-matched population-based controls. The most pronounced differences in 5-year OS were observed in patients with metastatic (71%) and locally advanced stage (42%), suggesting a potentially substantial impact of UTUC on patients’ life expectancy.
Statement of Ethics
Analyses and reporting followed the SEER reporting guidelines. Due to the anonymously coded design of the SEER database, this retrospective review of patient data did not require ethical approval or informed consent in accordance with national guidelines. The study has been conducted in accordance with the principles set in the Helsinki Declaration. Patient consent was waived due to the anonymously coded design of the SEER database.
Conflict of Interest Statement
The authors have no conflicts of interest to declare.
Funding Sources
The authors declare no funding was obtained or used for this study.
Author Contributions
Conceptualization, methodology, and writing – original draft: Carolin Siech. Formal analysis: Mario de Angelis, Letizia Maria Ippolita Jannello, Francesco Di Bello, Natali Rodriguez Peñaranda, and Jordan A. Goyal. Supervision: Felix K. H. Chun and Pierre I. Karakiewicz. Validation: Fred Saad, Shahrokh F. Shariat, Nicola Longo, Ottavio de Cobelli, Alberto Briganti, Mike Wenzel, Philipp Mandel, and Luis A. Kluth. Writing – review and editing: Mario de Angelis, Letizia Maria Ippolita Jannello, Francesco Di Bello, Natali Rodriguez Peñaranda, Jordan A. Goyal, Fred Saad, Shahrokh F. Shariat, Salvatore Micali, Nicola Longo, Ottavio de Cobelli, Alberto Briganti, Mike Wenzel, Philipp Mandel, Luis A. Kluth, Felix K. H. Chun, and Pierre I. Karakiewicz. All authors have read and agreed to the published version of the manuscript.
Data Availability Statement
All analyses and their reporting followed the SEER reporting guidelines. The data used in this study (SEER 2004–2020) are available in the SEER Incidence Data 1975–2020 repository, https://seer.cancer.gov/data/. Further information is available from the corresponding author upon request.


